Hammer Candlestick: What it is and how to use it


The cryptocurrency market can be tough to navigate at times. Market participants must conduct thorough technical analysis to succeed within the market — a candlestick chart is one of the most popular tools used to carry out technical analysis. If used correctly, they can be extremely helpful in noticing patterns and forming your trading strategies. Learning how to read them is not only beneficial for crypto trading but also for stock trading, forex trading, and other markets.
One of the most common candlestick patterns is the hammer candlestick pattern. This guide will explain the hammer candlestick pattern, what it looks like, and what it means.
What is the hammer candlestick pattern?
The hammer candlestick pattern can be utilized in most financial markets. It is a pattern that most traders like to see as the hammer candlestick is a bullish signal that announces a bullish reversal within the market. Once identified, it can be used alongside other trading methods and indicators. The hammer candlestick can signal an upcoming trend reversal, while other tools can help confirm the reversal.
What does the hammer pattern look like?
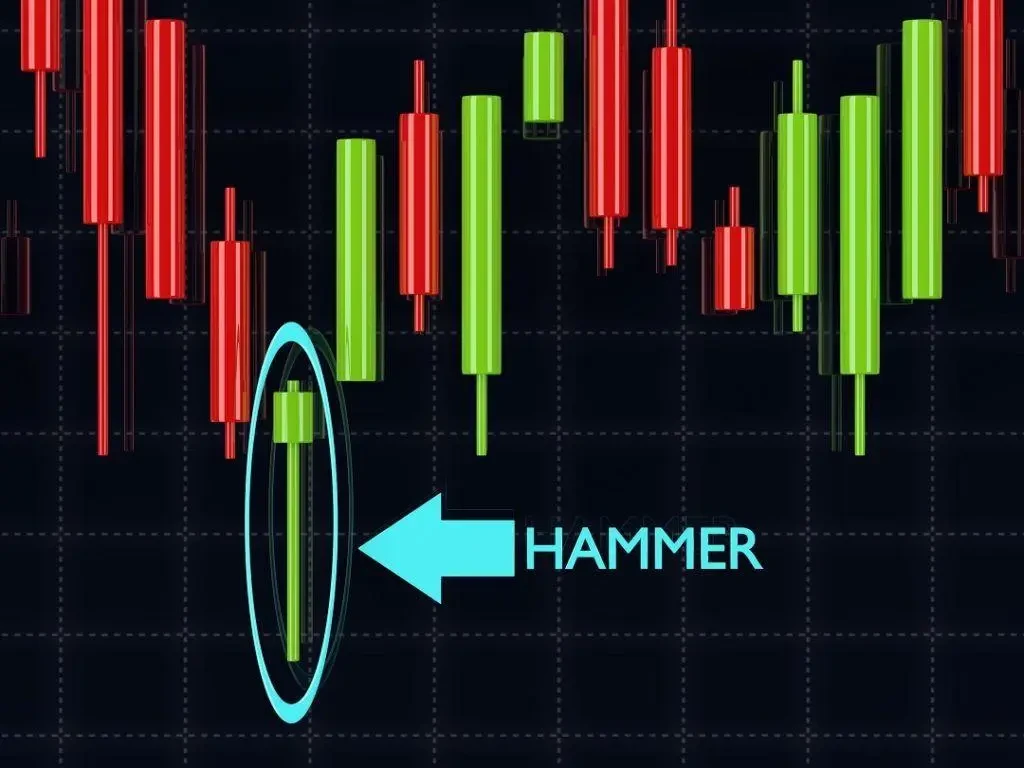
The hammer pattern is very easy to spot on a candlestick chart. It is a single candlestick pattern with a small body and a long downward wick.
The candlestick's success rate mainly depends on the length of the wick compared to the body. A strong hammer candlestick pattern has a wick that is two times the size of the body of the candle. Generally speaking, the longer the wick, the stronger the reversal.
Other variations of hammer candlesticks
Traditional hammer candlesticks signal bullish reversals. This can happen in any market; you can use it regardless of whether you are into crypto or forex trading.
However, a hammer candlestick can come in different shapes and forms, each with its own meaning. Some hammers are considered bullish hammers, while others are bearish. Here is a list of some other candlestick patterns.
1. Hammer candlestick
The first is the regular, traditional hammer candlestick. It is a bullish candlestick pattern formed when the closing price is above the opening price. As such, it suggests that the selling pressure was high, but the buyers took control of the market.
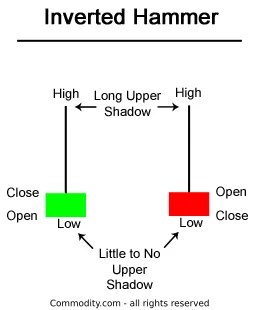
2. Inverted hammer candlestick
The second is the inverted hammer candlestick, which is another bullish signal. It forms when the opening price is below the closing price. However, this time, a long wick is above the candle's body. This suggests intense buying pressure was seeking to push the price up. However, it was eventually dragged back down before the candle could close. While this pattern is not as bullish as the regular hammer candlestick, it still signals a strong influence from the buyers.
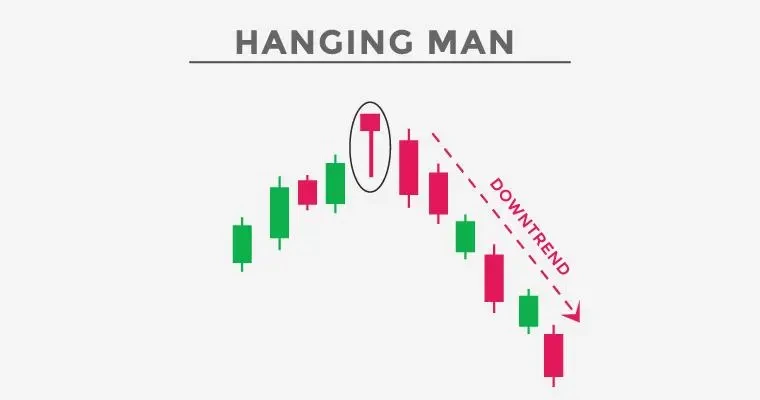
3. Hanging man candlestick
Next, we have a hammer that represents a bearish signal. It is known as the Hanging Man candlestick and forms when the open price is above the closing price, leading to a red candle. This hammer's lower wick is long, indicating that the market has experienced selling pressure. As the closing price is below the opening price, it's assumed sellers still have control of the market. This is why the hanging man candlestick is considered bearish.
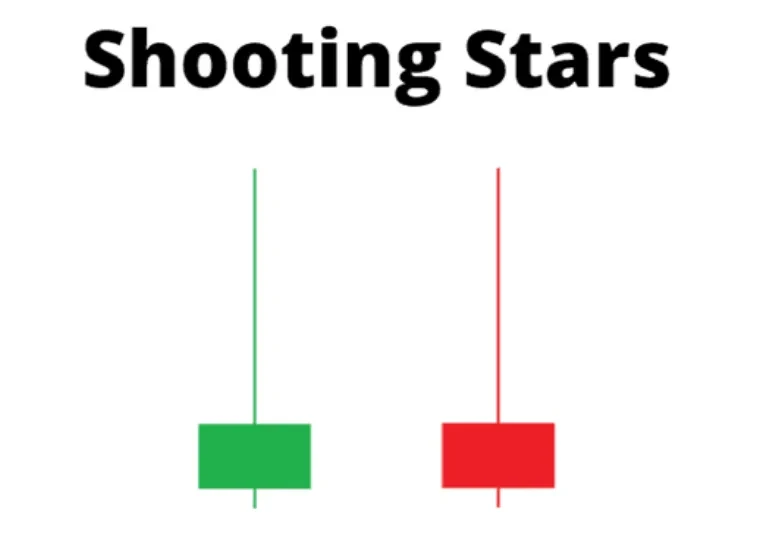
4. Shooting star candlestick
Finally, we have the shooting star candlestick, which is also a bearish pattern. It resembles a regular inverted hammer candlestick but announces a bearish reversal. They are formed when the price attempts to break out towards the upside, but ultimately, the candle closes below its opening price, suggesting an incoming bearish reversal.
How to trade with the hammer pattern?
Traders who spot one of the hammer patterns can use this knowledge to their advantage. As always, you should not rely on the hammer's appearance alone. The hammer candlestick should be used as a signal to look into the market. This typically involves consulting other technical indicators, such as moving averages. Fundamental analysis can also be useful, as it might reveal an event that sparked the growth of the buying pressure.
Advantages and limitations of the hammer candlestick pattern
The hammer candlestick pattern has its benefits as well as its limitations. To sum them up, we have created a pros and cons list for the hammer pattern.
Pros:
- It shows a reliable price trend in all financial markets
- It combines well with other price action tools
- Market participants can use the hammer as a trend reversal or trend continuation pattern
- Hammer candlesticks are easy to identify
Cons:
- It is not 100 percent reliable and might send a false signal. The price could still keep dropping even after a hammer appears
- Traders cannot rely solely on this single indicator and make their decisions on its appearance alone
Why you should remember the hammer candlestick pattern
Like other patterns that appear on charts, the hammer candlestick pattern has advantages and disadvantages. Its most significant drawback is that it could provide false signals. The appearance of a hammer candlestick suggests that a trend reversal was coming, but something may have disrupted it.
However, the hammer candlesticks are easy to spot, and show up relatively often. The only thing to remember is to wait to act on it, as you should always confirm the trend via other indicators. This is the risk that comes with trading cryptocurrencies. Their volatility makes it difficult to navigate the market, and participants must always be vigilant and cautious.
FAQs
Is a hammer bullish or bearish?
The regular hammer candlestick is a bullish signal. However, the hammer can appear in bearish forms, as explained in this guide. The two bearish forms that it takes are known as the hanging man and shooting star.
Where do hammer candlesticks form?
The hammer candlestick typically forms at the bottom of a downtrend. It is taken as a signal of a potential bullish reversal. However, it does not guarantee it, as the price could continue dropping despite its formation.
How to identify a hammer candlestick pattern?
Hammer candlesticks are defined by relatively small bodies with long wicks. The wicks are typically at least two times longer than the candle's body. This is considered a strong hammer, as the greater the length of the wick, the stronger the reversal.
Is hammer candlestick reliable?
The hammer candle is a good indicator of a trend reversal because it is easy to spot. However, it is not 100% reliable, and traders cannot act on it alone. They must remember to confirm the trend reversal's legitimacy through other means.
© 2025 OKX. Denna artikel får reproduceras eller distribueras i sin helhet, eller så får utdrag på 100 ord eller mindre av denna artikel användas, förutsatt att sådan användning är icke-kommersiell. All reproduktion eller distribution av hela artikeln måste också anges på en framträdande plats: ”Den här artikeln är © 2025 OKX och används med tillstånd.” Tillåtna utdrag måste hänvisa till artikelns namn och inkludera attribut, till exempel ”Artikelnamn, [författarens namn om tillämpligt], © 2025 OKX.” En del innehåll kan genereras eller assisteras av verktyg med artificiell intelligens (AI). Inga härledda verk eller annan användning av denna artikel är tillåten.
Relaterade artiklar
Visa mer
9 non-technical indicators that signal we're in a crypto bull market
The options wheel strategy: get passive crypto gains in two steps
Crypto cash-secured puts: selling put options for a better entry

A beginner's guide to multi-leg crypto option strategies

Interest rate cuts: how do Fed rate cuts impact crypto prices?
